Industrial survey in the private sector 2009
The Central Bureau of Statistics ( Economic Statistics Directorate ) annually implements an
industrial survey in the private sector depending on the establishments frame resulting from the restriction process for 2004
and synchronous with the general census process of the population & housing in addition to new establishments ( licenses to establish new industrial
establishments) which are obtained by economic statistics directorate from the industrial directorates through the statistics directorates in the governorates.
Also the observations of the field statistical researchers benefit to make the necessary annual modifications on that frame .
For this year the survey was accomplished by two methods: the first one is the Sample (1 – 9 worker ) and the second is the total restriction and
census ( 10 worker and more ).
Table ( A ) :
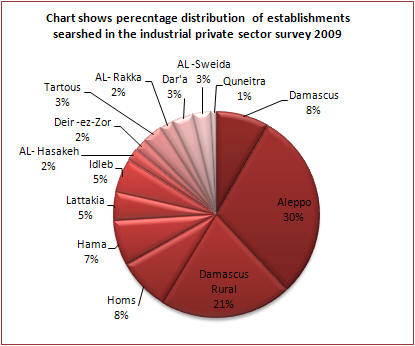
This table Shows the industrial establishments number that were searched for ( sample and total census) according to governorates.

Table ( B ) :
This table includes Comparison between more important economic indicators in both public and private sectors related to the manufacturing industry except oil refinery .
Table ( C ) :
This table includes the total number of the industrial establishments according to governorates 2009.
Table ( 1 ) :
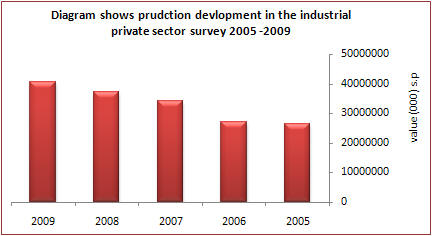
This table shows some indicators related to industrial production in the private sector according to governorates for 2009.
Table ( 2 ) :
The same indicators and economic relations which were mentioned in table (1) according to economic activity groups.
Table ( 3 ) :
In this table the same indicators and economic relations which were mentioned in table (2)were calculated by workers groups.
Table ( 4 ) :
This table includes relation indicators between gross output value and the values of sold quantities of the production .
Table ( 5 ) :
In this table the indicators which were mentioned above in table ( 4 ) were calculated but according to economic activity groups.
Table ( 6 ) :
This table includes the same indicators in table ( 4 ) through this table the establishments contribution appears by workers groups.

Table ( 7 ) :
This table shows the fixed assets movement in the survey year through the presentation of the value in the beginning
of the year and the purchased assets during the year with other additions after depreciation calculation.
Table ( 8 ) :
This table includes the same indicators of the previous table on the level of economic activity groups.
Table ( 9 ) :
This table includes indicators in table ( 8 ) but according to workers groups.
Table (10) :
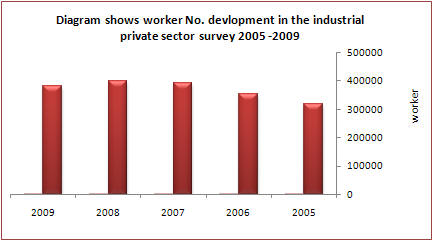
This table includes indicators group related to industrial private sector workers.
Table (11) :
The indicators which were mentioned in table ( 10 ) were calculated according to economic activity groups.
Table (12) :
This table includes the indicators in table ( 11 ) which were calculated according to employment size in the establishments.

Table ( 13 ) :
Some establishments ( like olive presses ,sewing shops , mills and others ) work for the other party and this revenues which were offered by the other are added to production in this establishments according to the national accounts system, while the production to benefit the other not added to the establishment production and appeared in this table as an indicator of the industrial statistics needs.
Table ( 14 ) :
This table includes the same indicators in table ( 13 ) on the level of workers groups.


